
Social media analytics is just a fancy term for collecting and looking at the data from your social media accounts to figure out what’s working and what’s not. It’s all about turning raw numbers like likes, shares, and follower counts into real-world insights you can actually use to grow your business.
Decoding Your Digital Footprint
Think of your brand's social media accounts as a huge, non-stop conversation with thousands of people. Social media analytics is simply the art of listening in on that conversation. You're not just counting who's talking, but figuring out what they're saying, how they feel, and what grabs their attention.
Let's ditch the scary spreadsheets and complicated dashboards for a second. Imagine you're a coach with a playbook for the big game. You wouldn’t just count the cheers from the crowd (likes and follows); you'd break down the specific plays (posts, videos, and stories) that actually scored points. That's exactly what analytics does for your marketing.
This whole practice is about looking past the surface-level numbers to see the story they're telling. It helps you find answers to the big questions that really define whether your marketing is hitting the mark.
Why Your Numbers Tell a Story
Every single interaction on your social channels—every like, comment, share, and click—leaves a digital footprint. Each one is a clue. When you start putting those clues together, you get a crystal-clear picture of your audience and your content.
Social media analytics is the bridge between what you think your audience wants and what the data proves they actually engage with. It replaces guesswork with a data-backed strategy, ensuring your efforts are always moving the needle.
For example, a post about a new product feature getting tons of shares tells you that your audience finds it genuinely valuable—so much so, they want to show it to their friends. On the flip side, if an ad has a super low click-through rate, that’s a big red flag that your call-to-action is falling flat.
From Raw Data to Actionable Insights
So, how does this actually work? It’s a structured way of gathering, analyzing, and using all this data to make smarter moves. It boils down to a few key steps:
- Gathering Data: This means pulling metrics from all your social accounts—Instagram, TikTok, Facebook, LinkedIn, Google Business Profiles, you name it. This is all done with user privacy in mind, and you can always check out how platforms handle data by reading their policies, like OneUp’s privacy policy.
- Analyzing Performance: This is where you look for patterns. Which types of posts are killing it? What time of day is your audience most plugged in? How are you stacking up against your competitors?
- Creating Reports: Finally, you need to turn those findings into reports that are easy to digest, so everyone on your team can see what’s working and plan what’s next.
For a quick overview of what we just covered, here’s a simple breakdown:
Social Media Analytics At a Glance
| Component | Description |
|---|---|
| Data Collection | Pulling metrics like likes, comments, shares, and reach from social platforms. |
| Performance Analysis | Identifying trends, top-performing content, and audience behavior patterns. |
| Strategic Reporting | Turning raw data into clear reports that inform future marketing decisions. |
| Actionable Insights | The ultimate goal: using the data to make smarter choices that improve results. |
This process might sound like a lot of work, but it doesn't have to be.
Platforms like OneUp make this whole process a breeze by offering powerful post-level and summary analytics all in one spot. Instead of logging into five different platforms to pull numbers, you get one unified dashboard showing your entire social media footprint. You can even create custom cross-network reports to compare how your Instagram Reels are doing against your TikTok videos or set up automated email reporting to get insights sent straight to your inbox. It even allows you to compare different time periods to track growth, making data-driven decisions an effortless part of your routine.
How Analytics Turns Data Into Dollars
Knowing what social media analytics is gets you to the starting line. But connecting those numbers to actual business growth? That's how you win the race.
Let's be honest, raw data like likes and follower counts feels good, but it doesn't pay the bills. The real magic happens when you translate abstract metrics into tangible, profitable outcomes. This is about making smarter decisions that directly impact your bottom line—the difference between blindly throwing content at the wall and strategically crafting messages that drive real action.
Think about it: analyzing the sentiment in your comments isn't just a vanity exercise. It’s a direct line into what your customers are thinking. Positive feedback can be gold for testimonials, while negative comments are basically a free, real-time roadmap for fixing your product or customer service.
Justify Your Marketing Spend
Every marketing team has been there, facing the dreaded question: "So, what are we actually getting for all this money?" Social media analytics is your definitive answer.
By tracking metrics like click-through rates (CTR) and website conversions from your posts, you can draw a straight line from a specific piece of content to a new lead or sale. Suddenly, social media isn't a cost center anymore; it's a proven revenue driver.
When you can walk into a meeting and show that a $500 Facebook ad campaign brought in $2,500 in sales, the conversation about your budget changes completely. Proving this return on investment (ROI) is how you secure more resources and build trust.
Craft a Winning Content Strategy
Guesswork is expensive. Analytics replaces it with a data-backed content strategy that actually works. By looking at which posts get the most engagement—the saves, shares, and comments—you learn exactly what your audience wants to see.
- Infographic gets a ton of shares? Your audience values educational, bite-sized content. Double down on that.
- Text-only posts falling flat? That's a clear signal they prefer visuals. Time to pivot to more video or high-quality images.
- A behind-the-scenes Reel got a huge spike in views? People are craving authenticity. Show them more of the human side of your brand.
This creates a continuous feedback loop. Your content calendar starts filling up with posts that are almost guaranteed to perform well, which saves a ton of time and massively boosts your results.
Deepen Customer Relationships
Social media is a two-way conversation, and analytics helps you listen better than ever. By keeping an eye on comments, DMs, and mentions, you can spot your biggest brand fans and engage with them directly. This is how you turn happy customers into a loyal, vocal community.
Analytics allows you to listen at scale. It uncovers the unspoken needs and pain points of your audience, giving you the insights to create solutions and build relationships that last a lifetime.
A tool like OneUp’s unified social inbox is a game-changer for this. It pulls all your comments, DMs, and even Google reviews into one dashboard. This means you can see the feedback rolling in on a high-performing post and reply instantly, all without juggling a dozen different apps.
Gain a Competitive Edge
Your competitors are sitting on a goldmine of information, and analytics is the key to unlocking it. By watching their top-performing posts, you can basically reverse-engineer their success. What topics are driving their engagement? Which formats are they sleeping on?
This kind of analysis shows you exactly where the gaps are in their strategy. If a competitor is totally ignoring a platform where your target audience hangs out, that's your cue to jump in. This intelligence lets you move faster, react to market shifts, and position your brand as the leader.
There's a reason the social media analytics market is exploding, projected to jump from USD 9.32 billion in 2025 to USD 21.71 billion by 2030. Businesses need scalable tools to make sense of billions of daily interactions. You can discover more insights about the expanding social media analytics market on Mordor Intelligence.
This is where a powerful, affordable tool becomes a superpower. For agencies and SMBs, a platform like OneUp, which offers unlimited social accounts and analytics for a fixed price, is huge. It lets you scale your tracking and reporting across every client or location without your costs spiraling out of control, ensuring you always have the data you need to turn insights into dollars.
The Essential Metrics That Actually Matter
Jumping into your social media analytics can feel like trying to drink from a firehose. You’re hit with a flood of data, and it's easy to get lost. But here’s the secret: a winning strategy isn't about tracking every single number. It’s about knowing which handful of metrics tell you the real story of what’s working and what’s falling flat.
To cut through the noise, we can sort the most important metrics into four key categories. Think of them as different stages of a customer's journey with your brand, from their first glance to becoming a dedicated fan. Getting a handle on these will help you figure out where you’re succeeding and make much smarter decisions.
This is exactly why descriptive analytics—figuring out what happened, when, and why—has become so critical. The global social media analytics market is expected to balloon from USD 14.17 billion in 2025 to a massive USD 95.64 billion by 2034, all because businesses need to understand this stuff. For anyone managing social media, knowing why a carousel post suddenly blew up or spotting positive vibes in the comments isn't just nice to have; it's essential. You can read the full research about the social media analytics market to see just how fast it's growing.
This chart shows how smart marketers turn data into dollars by using analytics to justify their budget, nail their creative, and stay ahead of the competition.
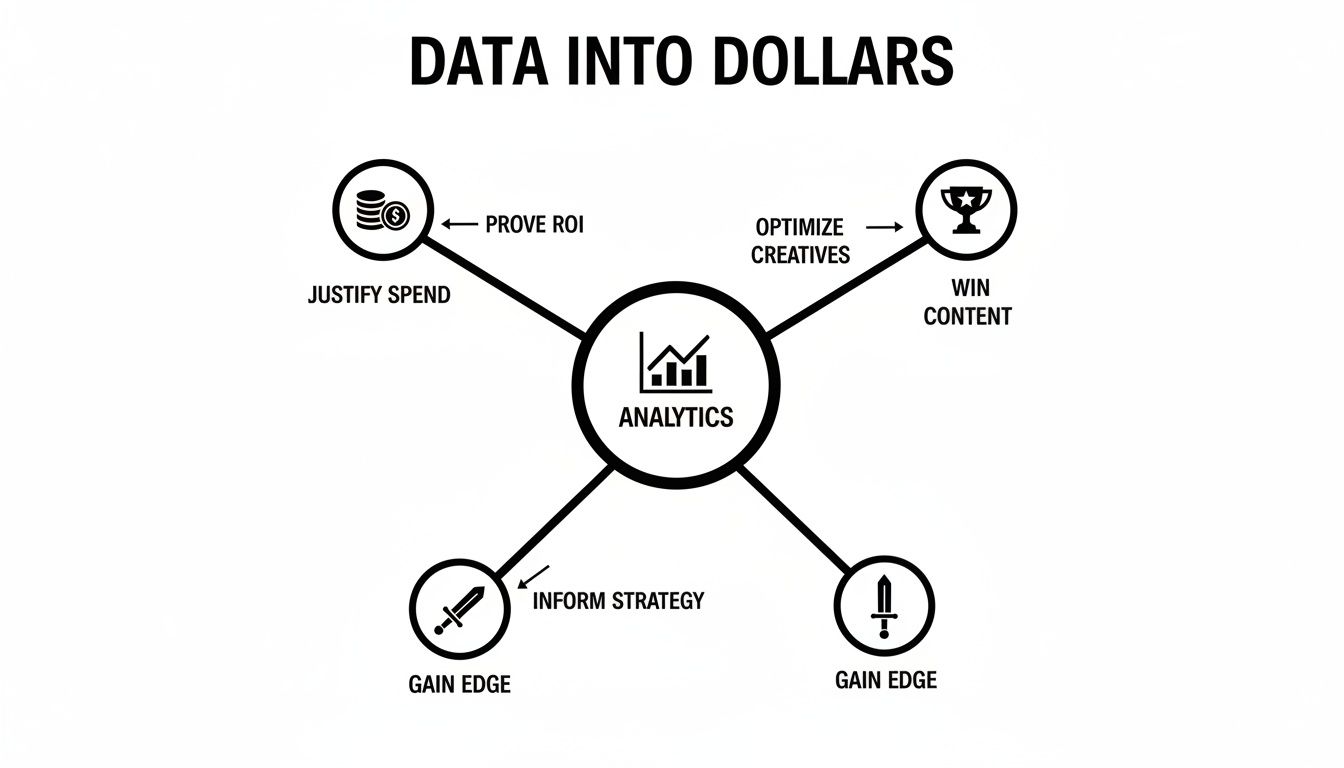
It’s clear that analytics is the engine that turns raw numbers into real business results, proving its worth time and time again.
Before we dive into the four categories, let's clear up some common points of confusion. Metrics like Reach and Impressions, or even different types of Engagement, can sound similar but tell you very different things about your performance.
Core Social Media Metrics Explained
| Metric | What It Measures | Why It's Important |
|---|---|---|
| Reach | The total number of unique people who saw your content. | Shows the actual size of your audience. It's about how many individual people your message got in front of. |
| Impressions | The total number of times your content was displayed on a screen. | Measures frequency. One person seeing a post 5 times equals 5 impressions, which can tell you how well your content is circulating. |
| Engagement Rate | Total engagements (likes, comments, etc.) divided by reach or followers. | Provides a standardized way to measure how compelling your content is, no matter how big or small your audience is. |
| Click-Through Rate (CTR) | The percentage of people who clicked a link in your post. | A direct measure of how well your call-to-action is working. It shows if you're successfully moving people off-platform. |
Understanding these distinctions is the first step. Now, let's see how they fit into a bigger picture.
Awareness Metrics
These metrics are all about visibility. They tell you how many eyeballs are on your content and how big of a footprint your brand has online. This is the top of your funnel.
- Reach: As we covered, this is the total number of unique people who see your post. Think of it as the headcount at a concert. It measures the true breadth of your audience.
- Impressions: This is the total number of times your content pops up on a screen. One person could see your post three times, which would count as 1 Reach and 3 Impressions. This number measures how often your content is being shown.
Both are useful, but reach is usually the better indicator of genuine audience growth. High impressions can tell you if the algorithm is giving your content a good push.
Engagement Metrics
Engagement is the lifeblood of social media. It’s proof that people aren't just scrolling past your content—they’re actually stopping to interact with it. These interactions are powerful signals to the algorithms that your stuff is worth showing to more people.
- Likes, Comments, and Shares: The classic trio. A like is a quick thumbs-up, a comment opens up a conversation, and a share is the ultimate compliment—someone liked your content so much they put their own name on it and passed it along.
- Saves: This is a huge one, especially on platforms like Instagram and TikTok. When someone saves your post, they're flagging it as a valuable resource to come back to later. It's a massive vote of confidence.
- Engagement Rate: This is your total engagements divided by your reach or impressions. It levels the playing field, giving you a clear sense of how interesting your content is, regardless of how many followers you have.
A high engagement rate is way more valuable than a huge follower count with crickets in the comments. It means you have an active, interested community, not just a list of names.
Getting down to the nitty-gritty is key here. Tools like OneUp offer powerful post-level analytics, so you can see exactly how every single post performed across Instagram, TikTok, Facebook, LinkedIn, and even your Google Business Profiles. This helps you pinpoint which topics, formats, or visuals are getting people to act.
Conversion Metrics
This is where your social media efforts start to look like real business results. Conversion metrics track how well you're convincing your audience to take a specific, valuable action.
- Click-Through Rate (CTR): The percentage of people who saw your post and actually clicked the link in it. It’s a straightforward measure of how persuasive your call-to-action is.
- Conversion Rate: This takes it a step further. It tracks the percentage of people who clicked your link and then did the thing you wanted them to do on your site, like signing up for a newsletter, downloading a guide, or making a purchase.
Audience Metrics
Finally, you need to know who you’re talking to. These metrics help you understand your audience's makeup and how it’s changing over time, ensuring your content is hitting the mark with the right people.
- Audience Growth Rate: This shows how quickly you're attracting new followers. A steady, positive growth rate is a sign of a healthy, relevant brand.
- Demographics: This includes data like the age, gender, location, and language of your followers. Knowing these details is crucial for tailoring your messaging so it truly connects.
For instance, checking your demographics might reveal a surprise surge of followers in a new city, giving you a perfect opportunity to run a targeted local campaign. To find the right language that resonates with different groups, an Instagram hashtag generator can be surprisingly helpful for discovering popular and relevant terms.
Building Your Social Media Measurement Plan

Knowing your metrics is just the start. The real magic happens when you turn those numbers into a cohesive strategy. A solid measurement plan is your roadmap, connecting every single post, share, and comment back to a meaningful business result.
Without a plan, you're just collecting numbers for the sake of it. With one, you’re building a data-driven engine for growth.
This isn’t some overly complex framework. It’s a practical, four-step process that any business—from a local restaurant to a multi-client marketing agency—can put into action right away.
Set Clear Business Goals
Before you even think about tracking a single like, you have to know why you’re on social media in the first place. Your social media goals can't exist in a vacuum; they need to be a direct reflection of what your business is trying to achieve.
Are you trying to drive more online sales? Get more people walking through your doors? Or maybe just become the go-to name in your industry?
Get specific. A vague goal like "grow our brand" won't cut it. Aim for something concrete you can actually measure:
- Increase online sales for our new product line by 15% in Q3.
- Drive 50 more reservations per month through social media.
- Boost local foot traffic by promoting our weekly in-store event.
These goals become the bedrock of your entire plan. Every metric you track from here on out should directly answer the question: "Are we getting closer to hitting these targets?"
Select Relevant KPIs for Each Goal
Okay, goals are set. Now you need to pick the Key Performance Indicators (KPIs) that will tell you if you're making progress. Each goal needs its own set of metrics. This is crucial for avoiding the trap of chasing vanity metrics that look good on paper but don't actually move the needle for your business.
For example:
- Goal: Increase Online Sales → Your KPIs would be things like Website Click-Through Rate (CTR) from your posts, the Conversion Rate of that social traffic, and how many Add to Carts you get.
- Goal: Drive Foot Traffic → You’d want to track engagement on your Google Business Profile posts, any social media check-ins, and the Reach of your locally targeted ads.
Connecting specific KPIs to business goals is the most critical step in proving social media's value. It transforms your analytics from a simple report card into a strategic tool that justifies your marketing budget.
Little details matter here, too. Knowing things like Instagram video length limits helps you create content that’s optimized to perform well from the very beginning, making your KPIs much easier to hit.
Choose Your Analytics Toolkit
With your goals and KPIs defined, you need the right tools to actually gather and make sense of the data. Sure, you can hop between the native analytics on each platform, but that creates data silos and is a massive time-sink.
A unified tool is the way to go for seeing the complete picture.
A platform like OneUp pulls all your data under one roof. You can use its custom cross-network reports to directly compare how your Instagram Reels are doing against your TikTok videos, side-by-side. It gives you deep post-level and summary analytics for all your accounts—Facebook, LinkedIn, Google Business Profiles, you name it—saving you hours of manual spreadsheet work.
Establish a Reporting Rhythm
Finally, you need consistency. Your analytics are worthless if you don't look at them regularly and use what you learn. The key is to establish a reporting cadence that works for your team and keeps you on track.
- Weekly Check-ins: A quick, 15-minute look at your top-performing posts and any spikes in audience engagement.
- Monthly Deep Dives: A more thorough review of how you’re progressing against your KPIs for each goal.
- Quarterly Strategy Reviews: A high-level look at the big picture. Is the overall strategy working? What needs to change to better hit your business goals?
The best part? This reporting rhythm can be almost completely automated. With a tool like OneUp, you can set up automated email reporting to send weekly or monthly performance summaries straight to your inbox (or your clients'). This feature essentially puts your measurement plan on autopilot, ensuring you always have the insights you need to make smart, timely decisions.
Choosing the Right Tools for Effortless Analytics
Let's be honest. Manually pulling data from Instagram Insights, then jumping over to TikTok Analytics, and finally wrestling with a Facebook spreadsheet is a recipe for burnout. It’s slow, tedious, and turns a strategic task into a mind-numbing chore. This is exactly why a dedicated analytics tool isn’t some fancy extra—it’s an absolute necessity for any serious social media manager.
Without the right tool, you’re trapped in data chaos. Trying to compare an Instagram Reel's performance against a TikTok video becomes a frustrating guessing game. You're left trying to line up metrics that don't quite match, making it impossible to get a clear, big-picture view of what’s actually moving the needle.
A dedicated platform cuts through all that noise. It pulls all your scattered data streams into one central hub, turning a mess of numbers into a clear, unified story. Suddenly, you have the power to make smarter decisions, faster.
Unify Your Data with a Single Dashboard
The biggest win from a social media analytics tool is creating a single source of truth. Forget logging into five different platforms. You get one clean, consolidated view of everything.
This is precisely what a platform like OneUp delivers with its unified analytics dashboard. It gathers data from all your connected accounts—Instagram, TikTok, Facebook, LinkedIn, X, and even your Google Business Profiles—so you can see your entire social media world at a glance.
A unified dashboard transforms analytics from a fragmented, time-consuming task into a streamlined, strategic process. It’s the difference between navigating with a dozen crumpled maps and using a single, powerful GPS.
This isn’t just about saving time; it’s about unlocking deeper insights. You can instantly spot which network is driving the most engagement or which content format is your star player across your entire strategy, all without juggling a dozen browser tabs.
Create Custom Reports That Tell a Story
Generic, one-size-fits-all reports rarely answer the real questions your team or clients have. To truly show the impact of your work, you need the flexibility to zero in on the metrics that actually matter for your specific goals.
A great tool lets you build reports tailored to what you need to know. For example, with OneUp's custom cross-network reports, you can put your Instagram Reels and TikTok videos head-to-head. This side-by-side comparison gives you concrete data to decide which platform is giving you more bang for your buck with short-form video, guiding both your budget and your creative energy.
You can spin up reports that highlight specific campaigns, track how your influencers are doing, or show progress toward key business objectives. OneUp even lets you white-label these reports with your own logo, which is perfect for agencies looking to deliver a professional, branded experience to clients.
Put Your Reporting on Autopilot
Manually building and sending reports every week or month is a grind. It’s the kind of repetitive work that steals time away from actual strategy. The best tools automate this whole process, making sure key insights land in the right inboxes without you having to do it all by hand.
Features like automated email reporting in OneUp are a lifesaver for agencies and in-house teams. You can set up weekly, bi-weekly, or monthly analytics summaries to be sent directly to your clients or your boss. It keeps everyone in the loop and proves the value of your work, all on autopilot.
This automation frees you up to focus on what you do best: digging into the insights and tweaking your strategy for even better results. To make your analytics truly effortless, it's vital to explore the best social media analytics tools and find the perfect match for your workflow.
Close the Loop Between Insight and Action
Analytics should never just be about looking at charts. The whole point is to turn what you learn into immediate, impactful action. A truly integrated tool connects your performance data directly to your day-to-day work, closing the gap between seeing what’s working and doing more of it.
This is where a feature like OneUp’s unified social inbox really shines. Imagine you spot a post in your report with a sudden explosion of comments. Instead of having to go hunt that post down on the native app, you can jump straight into the unified inbox, see all the comments in one feed, and start replying instantly.
This seamless connection lets you engage with your audience when they're most interested, turning a viral moment into a real customer relationship. It’s the final step that makes your analytics truly powerful. By exploring the full suite of features on platforms like OneUp, you can build a workflow that’s not just efficient, but incredibly effective.
Common Questions About Social Media Analytics
Even with a solid game plan, you're going to have questions as you get your hands dirty with social media analytics. It happens to everyone. Getting clear on the little details and best practices is what really separates a good strategy from a great one.
Think of this section as a quick reference guide to clear up some of the most common head-scratchers. Once we get these sorted out, you’ll be able to look at your data with a lot more confidence.
What Is the Difference Between Analytics and Listening?
This is a big one, but the distinction is pretty simple when you think about it.
Social media analytics is like looking in a mirror. It’s an internal look at your own channels—your Instagram, your Facebook page, your TikTok account, and so on. It’s all about measuring the performance of the content you actually created. Analytics answers the question, "How are we doing?" by tracking metrics like reach, engagement rate, and follower growth.
Social media listening, on the other hand, is like looking out a window. You're scanning the entire social media world for mentions of your brand, your competitors, and key industry topics. It’s about understanding the bigger picture and public sentiment. Listening answers the question, "What are people saying out there?" So, analytics is reviewing your own game footage, while listening is scouting the whole league.
How Often Should I Check My Analytics?
There's no single right answer here—your reporting rhythm has to match your goals. But getting overwhelmed by data is a real problem. That’s why a balanced, three-tiered approach usually works best.
Here’s a structure we recommend:
- Daily or Weekly Quick Checks: This is for the urgent stuff. Use a unified inbox to keep an eye on comments and messages. Is there a customer service fire to put out? A tool like OneUp’s unified social inbox is perfect for this because it pulls everything, even Google reviews, into one place.
- Monthly Performance Reviews: Time for a proper dive. Look at your trends, figure out which content really hit the mark with your audience, and see how you’re tracking toward your bigger goals.
- Quarterly Strategic Reviews: Zoom out and look at the big picture. Is your social strategy actually moving the needle for the business? Use these insights to map out your content and campaigns for the next three months.
With a platform like OneUp, you can set up automated email reporting to schedule these monthly and weekly reports. They land right in your inbox, giving you consistent insights without all the manual work.
Can I Analyze Social Media Performance for Free?
Yep, you absolutely can. Every big platform—Instagram Insights, Facebook Business Suite, you name it—has its own built-in analytics. They’re fantastic for getting a basic read on how you’re doing on that one channel.
The problem? They’re completely siloed. If you’re managing accounts on three, four, or five different networks, you'll burn hours exporting data from each one and trying to mash it all together in a spreadsheet. It’s a mess, and it’s where a dedicated tool really proves its worth.
Native analytics give you a single snapshot. A dedicated tool gives you the panoramic view of your entire social media ecosystem, connecting dots you'd never see when your data is all over the place.
A tool like OneUp is a game-changer here. It pulls all your data into one unified analytics dashboard. This means you can build custom cross-network reports to see how your Instagram efforts stack up against your Facebook strategy, all in one place. It saves a ton of time and delivers much, much deeper insights.
What Is a Good Engagement Rate to Aim For?
Sorry to disappoint, but there is no magic number. A "good" engagement rate is completely contextual. It changes wildly depending on your industry, the platform, how many followers you have, and even the type of content you post.
For a massive Instagram account, a 2% engagement rate might be phenomenal. But for a small, niche LinkedIn group, 5% might be just okay.
Instead of chasing some random number, focus on what actually matters:
- Your Own Performance: Your number one goal should be to beat your own records. Establish your baseline and work on improving it month after month.
- Your Competitors: See how you stack up against other players in your specific niche. That gives you a realistic benchmark to aim for.
At the end of the day, it's not about hitting a certain percentage. It's about figuring out what makes your audience tick and then giving them more of it.
Ready to stop juggling spreadsheets and start making data-driven decisions with ease? OneUp provides a powerful, all-in-one platform to schedule your content, manage your inbox, and track your performance with unified analytics. Get unlimited social accounts, posts, and analytics for one fixed price. Discover how OneUp can simplify your social media management today.