Measuring social media success isn't just about racking up likes and followers. It's about connecting what you do on social platforms to real, tangible business results. This means setting clear goals, tracking the right numbers (like engagement and conversion rates), and then analyzing that data to prove you’re getting a return on your investment. Done right, your social strategy becomes a powerhouse for hitting your company's biggest objectives.
What Social Media Success Actually Looks Like

Before you can measure a single thing, you have to know what you’re measuring against. The single biggest mistake I see brands make is chasing "vanity metrics"—those numbers that look impressive on a slide but don't actually move the needle for the business. A million followers is great for the ego, but it means very little if none of them ever become customers.
True success isn't a one-size-fits-all benchmark; it’s completely unique to your business goals. It's the critical first step in Defining Digital Marketing Success Beyond Vanity Metrics.
For instance, a B2B software company might define success as generating 20 qualified demo requests per month from their LinkedIn content. On the flip side, a DTC ecommerce brand could be aiming for 500 pieces of user-generated content on Instagram each quarter. Both are solid, meaningful goals, but they're worlds apart.
Aligning Social Goals With Business Objectives
Your social media goals can't exist in a silo. They need to be a direct extension of your core business objectives. If your company's main goal is to increase customer retention, your social media goal shouldn't be to "get more likes."
Instead, it should be something concrete and connected, like this:
- Business Objective: Increase customer retention.
- Social Media Goal: Decrease customer support response times on social channels by 50% and increase positive sentiment mentions by 20%.
Or how about this one:
- Business Objective: Drive sales for a new product.
- Social Media Goal: Generate 1,000 clicks to the new product page and achieve a 3% conversion rate from social traffic.
This direct link is what transforms social media from a "nice-to-have" into a genuine, value-driving asset. It's the difference between just posting and posting with a purpose.
A well-defined goal is your North Star. It guides everything—your content, your platform choices, and most importantly, how you measure success. Without it, you're just shouting into the void.
From Vague Ideas to SMART Goals
To turn your goals from fuzzy ideas into something you can actually work toward, they need to be SMART: Specific, Measurable, Achievable, Relevant, and Time-bound.
Let's see how this framework transforms a common, vague goal:
- Vague Idea: "I want to grow our Instagram."
- SMART Goal: "We will increase our Instagram follower growth rate by 3% month-over-month for the next quarter by posting two high-quality Reels per week and engaging with 10 industry-related accounts daily."
See the difference? Now you have a clear plan of action. While follower count can be a vanity metric, the follower growth rate is a much better indicator of audience expansion and brand authority. For context, top-performing accounts on high-engagement platforms like Instagram often see 1-5% monthly growth.
Connecting Business Goals to Social Media KPIs
To make this crystal clear, you need to map your high-level business objectives directly to the social media Key Performance Indicators (KPIs) you'll track. This table shows exactly how to make that connection.
| Business Objective | Primary Social Media Goal | Key Performance Indicators (KPIs) |
|---|---|---|
| Increase Brand Awareness | Expand reach to a new audience | Impressions, Reach, Follower Growth Rate, Share of Voice |
| Generate Leads | Drive qualified traffic to website | Clicks, Click-Through Rate (CTR), Leads Generated, Cost Per Lead (CPL) |
| Boost Sales & Revenue | Drive conversions from social | Conversion Rate, Revenue from Social, Average Order Value (AOV) |
| Improve Customer Loyalty | Foster an engaged community | Engagement Rate (likes, comments, shares), Response Time, Sentiment Score |
| Increase Website Traffic | Funnel users to key pages | Social Media Referrals, Bounce Rate from Social, Session Duration |
This table isn't just a list of metrics; it's a strategic framework. By starting with your core business objective, you ensure that every KPI you track is directly contributing to what matters most.
Choosing the Right Metrics for Each Platform
Trying to apply the same set of KPIs to every social network is a rookie mistake. It's like using a hammer for every job in your toolbox—you'll probably just end up breaking things.
To get a real sense of your social media success, you have to play by each platform's rules. What counts as a "win" on LinkedIn is worlds away from what you're aiming for on Instagram or TikTok.
This is why a platform-specific strategy is so important. It stops you from drawing the wrong conclusions. For example, a killer engagement rate on a post with low reach isn't a failure. It might actually be a huge win, showing you’ve found a powerful niche audience that loves what you're doing.
Instagram KPIs Your Brand Should Track
Instagram is all about visuals, discovery, and community. Honestly, it's less about driving clicks to a website and more about building a loyal, engaged group of fans.
So, your metrics here should reflect how well your content is connecting with people and how much your audience is growing.
- Engagement Rate by Reach: Forget engagement by followers. This is the metric that matters. It shows you how compelling your content is to the people who actually see it, which is what the algorithm really cares about.
- Reels Plays and Watch Time: Instagram is pushing video hard. These two metrics tell you if your short-form content is actually grabbing and holding attention. A high average watch time is a massive signal to the algorithm to show your stuff to more people.
- Hashtag Performance: Keep an eye on which hashtags are bringing in the most reach and engagement. This is how you fine-tune your strategy for getting discovered. A tool like OneUp's Instagram hashtag generator can be a lifesaver, giving you AI-powered ideas to get in front of new audiences.
- Story Taps Forward/Back and Exits: These little interactions tell a big story. Lots of taps back usually means people found something interesting enough to re-watch. A high exit rate, on the other hand, is a clear sign that you've lost their interest.
LinkedIn KPIs for Professional Impact
LinkedIn is the B2B playground. Success here is all about establishing thought leadership, making professional connections, and, of course, generating leads. You're not just trying to be seen; you're trying to be seen as a credible expert.
Your metrics should reflect professional influence and the value of your content.
- Click-Through Rate (CTR): This one is huge. A high CTR on links to your blog posts, whitepapers, or landing pages is direct proof that your content is moving people through your marketing funnel.
- Document Shares and Views: LinkedIn's native document feature is gold for sharing in-depth content. Tracking how many people view and share these is a direct measure of how valuable your professional audience finds your insights.
- Follower Demographics: Don't just look at follower count. Dig into the job titles, industries, and company sizes. If you see growth in your target demographic, you know your content strategy is hitting the mark.
- Engagement on Text-Only Posts: Don't sleep on long-form, text-only posts. They can perform incredibly well on LinkedIn. High engagement on these shows that your ideas are really connecting with your professional network.
Facebook and Beyond
For Facebook, you're usually looking at a mix of community-building and traffic-driving metrics. Reach is the foundation here; it sets the stage for everything else.
It's also worth noting how different platforms perform. Recent analysis for 2025 shows Instagram's average reach rate at 3.50%, which blows Facebook's 1.65% out of the water. This highlights just how critical it is to know the visibility potential of each network you're on. For a true measure of success, experts recommend tracking engagement by reach—it's just a more accurate way to see what's working.
Remember, the context behind the numbers is everything. A spike in impressions could be from a single viral post or steady, consistent growth—each scenario tells a different story about your strategy.
Ultimately, you need a custom dashboard for each channel you're on. Tools like OneUp make this way easier by letting you view analytics for each platform in one place. You can see how posts perform on Facebook, Instagram, LinkedIn, Google Business Profile, and even your personal Facebook profile, making it simpler to compare what works where.
Moving Beyond Likes to Meaningful Engagement
For years, social media managers chased likes and comments as the ultimate proof of success. While these interactions are nice to have, they're surface-level indicators at best. In today's algorithm-driven world, real success lies in understanding how your content resonates with the audience that actually sees it, not just your total follower count.
This is where a more powerful metric comes into play: Engagement Rate by Reach. It's a game-changer for accurately measuring content quality.
The formula is simple but revealing:
Engagement Rate by Reach = (Total Interactions / Total Reach) x 100
This calculation tells you the percentage of people who, after seeing your post in their feed, were compelled enough to interact with it. It filters out the noise of vanity metrics and gives you a pure signal of your content's effectiveness.
Why Reach Is the Superior Denominator
Think about it this way. If you have 100,000 followers but the algorithm only shows your post to 10,000 of them, is it fair to judge its performance against your entire follower base? Of course not. A post with 500 likes might look like a failure with a 0.5% engagement rate by followers, but if it reached only 10,000 people, its engagement rate by reach is a very healthy 5%.
This shift in perspective is crucial for measuring social media success. It moves you from asking "How many people liked this?" to "How effective was this content at engaging the people it reached?"
This approach levels the playing field, especially when comparing performance across different platforms with vastly different algorithmic behaviors.
For example, fresh data from August 2024 shows that in 2025, Instagram leads with a 3.00% average engagement rate by reach, crushing Facebook's peak of 1.20%. On LinkedIn, the average is around 3-3.5% across industries, but documents can soar to an incredible 37%. You can dive deeper into these benchmarks with insights from Adobe.
Interpreting Different Types of Engagement
Not all interactions are created equal. A "like" is a passive nod, but a "share" or a "save" signifies a much deeper connection. When you're analyzing engagement, you have to look beyond the total number and break down the types of interactions you're getting.
Here’s a quick way to think about user intent:
- Likes: "I see this and I approve." It’s the lowest-effort interaction but still a positive signal.
- Comments: "I have something to say about this." This shows a higher level of interest and can spark valuable community conversations.
- Shares: "This is so good, my own network needs to see it." This is a huge endorsement and a key driver of organic reach.
- Saves: "This is so useful, I want to come back to it later." For platforms like Instagram, this is a massive signal to the algorithm that your content provides real value.
- Clicks: "I want to learn more." This is a direct measure of your content's ability to drive action and move users down your marketing funnel.
Understanding this hierarchy helps you sharpen your content strategy. If your goal is brand authority, you might focus on content that gets shares and saves. If you're driving traffic, clicks are your North Star.
Tools like OneUp make tracking these nuanced metrics much simpler. Instead of manually pulling data from each platform, you can view post-level and summary analytics in one place. OneUp also features a unified Social Inbox, allowing you to see and reply to comments and messages from Facebook, Instagram, and LinkedIn all in one feed, making community management more efficient and measurable.
This streamlined approach frees you up to spend less time crunching numbers and more time creating content that actually connects.
Automating Your Measurement with the Right Tools
Let's be real: manually pulling metrics from every single platform is a soul-crushing task. It's a surefire path to burnout, and worse, it’s ripe for human error. Juggling logins, exporting CSVs, and trying to mash all that data together in a spreadsheet eats up hours you could be spending on, you know, actual strategy.
The only way to win this game is to automate the grunt work. A solid social media management platform like OneUp brings everything under one roof, giving you back your most valuable asset: time. Instead of losing your Monday mornings to spreadsheets, you can jump straight into analyzing insights that actually move the needle. This is the critical shift—from just collecting data to actually interpreting it.
Streamlining Your Content and Measurement Workflow
Believe it or not, a good measurement system doesn't start with a report. It starts way earlier, with how you create and schedule your content. When your workflow is streamlined from the beginning, tracking becomes almost effortless.
With a tool like OneUp, your entire content calendar lives in one place. You can schedule posts across the board—even to personal Facebook profiles, Google Business Profiles, and Instagram via Zapier integration. By centralizing your publishing, you automatically create a single source of truth for everything you post.
This approach pays off big time when it's time to measure:
- Content Categorization: You can create and assign categories to your posts right as you schedule them. This makes it incredibly easy to test different content pillars (like "Educational," "Behind-the-Scenes," or "Promotional") and see what’s really working.
- Evergreen Content Recycling: OneUp's 'repeat post' feature is a game-changer. You can set your top-performing evergreen content to automatically repost at intervals you choose. Your best stuff keeps driving results without you lifting a finger.
- Efficient Content Creation: We all have those days when the creative well runs dry. Resources like the OneUp Instagram caption generator can help you whip up compelling copy in a pinch, keeping your calendar full.
Connecting Social Activity to Business ROI
Okay, this is the holy grail: connecting a specific social media post to a real business outcome, like website traffic or a sale. This is often the trickiest part of the whole process, but it gets a lot simpler when tracking is built into your workflow.
OneUp has a built-in URL shortener that lets you add custom UTM parameters to every single link you share. If you're not familiar, UTMs are just little snippets of code added to a URL that tell your analytics software exactly where a visitor came from.
By consistently using UTMs, you kill the guesswork. You'll know for a fact that a certain Facebook post brought in 50 website visits and 3 sales, while that LinkedIn article drove 20 visits and one high-value lead.
This is the kind of granular data that makes stakeholders sit up and listen. It transforms your reports from a page of vanity metrics into a clear story about business impact. You can finally prove, with hard numbers, how your social media efforts are contributing directly to the bottom line.
This visual breaks down the simple but powerful formula for calculating engagement rate based on reach—a core metric for understanding how good your content actually is.
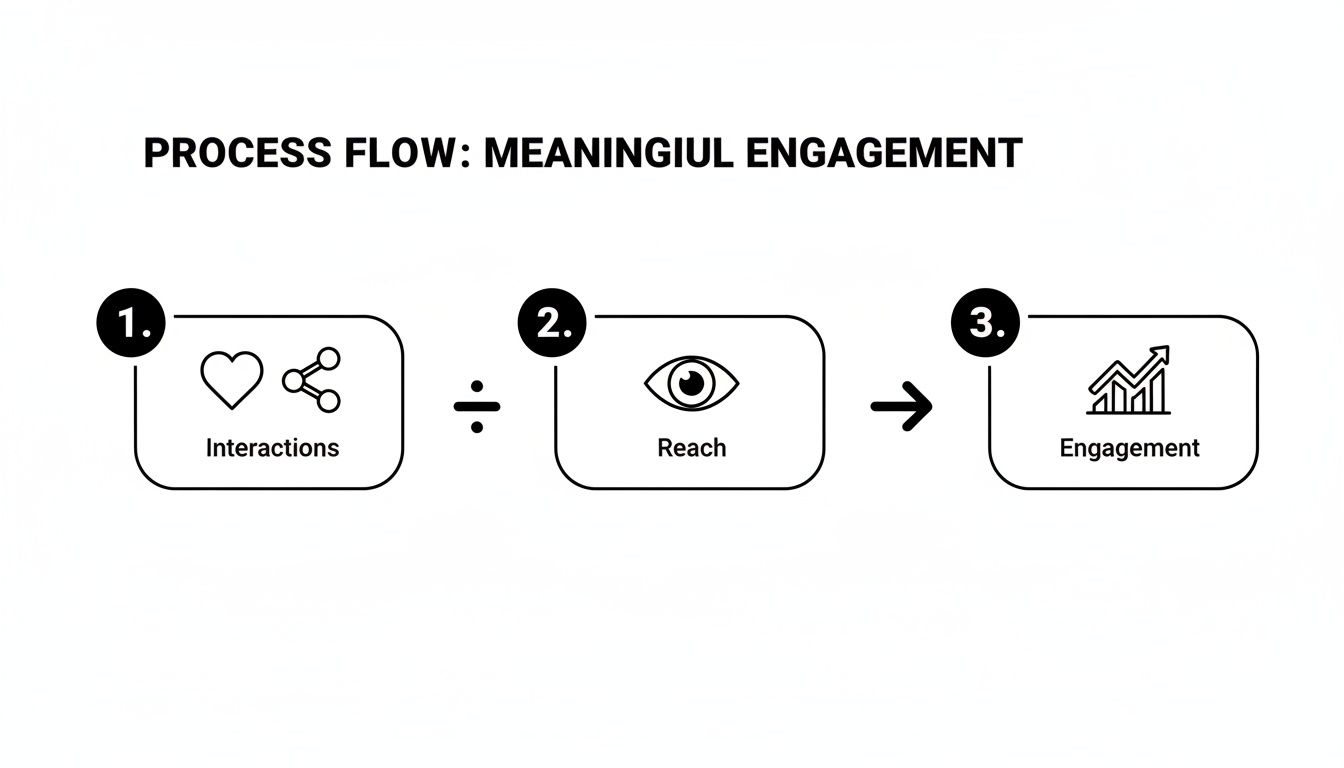
The flow here is key: real engagement isn't just about your follower count. It's about the percentage of people who saw your content (reach) and were compelled enough to interact with it. This metric gives you a much truer sense of what’s resonating with your audience. Having tools that calculate this for you is a massive time-saver and provides a much clearer picture of your performance.
Creating Reports That Actually Prove Your Value

Let's be honest: raw data is just noise. A spreadsheet crammed with impressions, likes, and clicks won't convince your boss or clients of your value. It doesn't tell a story.
The real magic in measuring social media success is turning those numbers into a compelling narrative that proves your impact on the business.
Your reports are the only bridge between the grind of your daily work and the C-suite's bottom-line focus. They need to be clear, full of context, and—most importantly—actionable. This is where you stop just showing data and start explaining what it all means for the company's goals.
To really nail this, you have to connect your work back to the big picture. Understanding the fundamentals of how to measure marketing ROI helps you frame your social metrics in a language executives understand: investment and return. It makes your reports infinitely more persuasive.
Tell a Story with Your Data
A great report guides the reader through a performance story. It should always answer three simple questions:
- What happened?
- Why did it happen?
- What should we do next?
Always lead with a high-level executive summary. This is your one-paragraph elevator pitch. Highlight the biggest wins, the key challenges, and your single top recommendation for the next month. Trust me, many stakeholders will only read this part, so make it count.
From there, structure your report to flow logically from broad awareness metrics (like reach) down to the nitty-gritty conversion data. This helps everyone connect the dots between your top-of-funnel activities and bottom-of-funnel results like leads and sales.
The Anatomy of a Report That Gets Read
Building a consistent, comprehensive report is a game-changer. Don't reinvent the wheel every month. Use a structured template that covers all the essential bases. It saves you a ton of time and makes it way easier for stakeholders to see progress over time.
Your report should have a clear structure that tells the whole story, from the big picture down to the specific wins. Here’s a template that I've found works wonders for keeping stakeholders engaged and informed.
Actionable Monthly Social Media Report Template
| Report Section | Content to Include | Purpose |
|---|---|---|
| Executive Summary | One paragraph highlighting top wins, key learnings, and a primary recommendation. | Gives busy stakeholders the most critical info in 30 seconds or less. |
| KPI Scorecard | Key metrics (Reach, Engagement Rate, Clicks, Conversions) vs. goals and previous periods. | Provides a quick, at-a-glance view of performance against targets. |
| Platform Deep Dive | A breakdown of what's working (and what's not) on each core social network. | Shows channel-specific insights and justifies where you're spending time and budget. |
| Top-Performing Content | Screenshots of your best posts with a brief analysis of why they worked. | Demonstrates you understand your audience and can replicate success. |
| Audience Insights | Notes on follower growth, demographic shifts, and community sentiment. | Shows you're not just broadcasting, but building a valuable and relevant community. |
| Key Learnings & Next Steps | A bulleted list of insights from the month and your action plan for the next 30 days. | Turns data into a forward-looking strategy and shows you're proactive. |
This structure ensures you’re not just presenting data, but providing context, analysis, and a clear path forward.
A report without recommendations is just a history lesson. The most valuable part of your analysis is translating insights into a clear, strategic plan for the next 30 days.
This is where a powerful tool becomes your best friend. For instance, OneUp lets you build and schedule white-labeled reports that can be automatically emailed to clients or stakeholders. Imagine creating a single, branded report with all your key metrics from Facebook, LinkedIn, Google Business Profile, and more. It saves you hours of mind-numbing data compilation.
Give Your Numbers Some Context with Benchmarking
Numbers in a vacuum are meaningless. Is a 5% engagement rate good? Who knows! It completely depends on your industry, the platform, and your own past performance.
Your report must provide context through benchmarking. Always compare your current performance against:
- Previous Periods: Show month-over-month and year-over-year trends. This highlights growth and helps you spot seasonal patterns.
- Your Own Goals: How are you tracking against the KPIs you set at the beginning of the quarter? Are you on pace, ahead, or behind?
- Industry Averages: Do a little research to find benchmarks for your specific industry. This shows how you stack up against the competition.
This comparative analysis is what separates a basic data dump from a truly strategic assessment. It proves to stakeholders not just what you did, but how well you did it.
The right tools simplify this whole process. Many teams use social media management solutions like OneUp to streamline their reporting workflow. Being able to automatically generate and schedule reports provides the consistency you need for effective, long-term benchmarking.
Answering Your Top Social Media Measurement Questions
Once you start digging into social media analytics, it's easy to get buried in questions. If you're scratching your head trying to figure out how to actually measure your success, you're not alone. Let's clear the air and tackle some of the most common hurdles people face.
How Often Should I Actually Be Reporting on This Stuff?
The honest answer? It depends entirely on what you're trying to achieve.
For the day-to-day grind of managing your accounts, you should be checking in on engagement pretty much daily. This is how you catch conversations as they happen and see if a piece of content is starting to take off. It’s all about being responsive.
But for real strategic insights, monthly reports are the gold standard. This gives you enough data to spot actual trends without getting bogged down by tiny, meaningless daily spikes and dips. Then, for the big-picture view—how you’re tracking against major business goals—quarterly reports are perfect. They let you zoom out and see the real impact you're making over time.
What's the Real Difference Between a Metric and a KPI?
This one trips a lot of people up, but the distinction is actually simple and super important.
- A metric is just a number you can track. Think likes, reach, follower count—any raw data point. It tells you something happened.
- A Key Performance Indicator (KPI) is a metric you've hand-picked because it directly measures progress toward a critical business goal. It’s a metric with a purpose.
For example, 'post likes' is a metric. But if your goal is to generate leads, then 'lead conversion rate from social campaign posts' is your KPI. It’s directly tied to a business outcome. Your KPIs are the metrics that actually prove your work has value.
A metric tells you what happened. A KPI tells you if what happened actually matters to the business.
Is It Possible to Measure Social Media ROI Without Direct Sales?
Absolutely. ROI isn't always about a direct cash transaction, especially for brands that aren't in e-commerce. You just have to get a little creative and assign a real monetary value to the other outcomes your social media work drives.
For example, you can calculate the value of the website traffic you generate. How much would you have paid for those same visitors through Google Ads? That's a tangible value. You could also measure the value of earned media by tracking brand mentions and shares. You can even frame it in terms of cost savings by comparing how much it costs to handle a customer service query on social versus your traditional call center.
Which Metrics Are Just "Vanity Metrics"?
Ah, the infamous vanity metrics. These are the numbers that look great on paper but don't really mean much for your bottom line. The classic examples are total followers or page likes.
Now, they aren't completely useless—a large following does signal some level of brand awareness. But if you're only tracking follower count, you’re missing the real story. It's easy to get distracted by big numbers that don't translate to business results.
Instead, shift your focus to metrics that show genuine action and intent from your audience. These are the numbers that give you real insight:
- Engagement rate by reach (how many people who saw your post actually interacted?)
- Conversion rate (how many people took the action you wanted?)
- Click-through rate (CTR) (how many people clicked your link?)
These metrics show you if your content is actually resonating and pushing people to take that next important step.
Ready to stop guessing and start getting clear insights? With OneUp, you can schedule posts, automatically recycle your best content, and build custom reports across all your networks to prove your value. It even has an AI caption writer and a unified inbox to handle all your comments and DMs in one spot. Simplify your social media workflow and start focusing on what truly matters. Try OneUp today.